
TL;DR:
- Website performance reviews analyze speed, stability, and user experience to improve business outcomes.
- Core Web Vitals like INP, LCP, and CLS directly impact bounce rates and search rankings.
- Regular monitoring and process integration turn technical data into ongoing business growth.
Most business owners assume their website is performing well simply because it loads on their own device. The reality is far more sobering. 43% of sites fail the INP threshold of under 200ms in 2026, and sites that pass all Core Web Vitals see 24% lower bounce rates alongside measurably better search rankings. For small and mid-sized businesses, a slow or unstable site is not just a technical inconvenience — it is a direct drain on leads, revenue, and customer trust. This guide breaks down exactly what website performance reviews are, what metrics matter, and how to turn technical data into real business growth.
Table of Contents
- What is a website performance review?
- The core metrics: INP, LCP, and CLS explained
- Lab vs. field data: how SMBs should interpret their results
- Common performance pitfalls and quick wins for 2026
- Turning performance reviews into business results
- Why most SMBs misunderstand website performance reviews
- How AI-driven services put performance reviews on autopilot
- Frequently asked questions
Key Takeaways
| Point | Details |
|---|---|
| Performance reviews drive growth | Regular reviews improve speed, SEO, and keep visitors engaged for more leads and sales. |
| Metrics beyond the score | Understanding INP, LCP, and CLS helps you target changes that truly move the business needle. |
| Field data is king | Focus on real user metrics like CrUX and RUM to prevent regressions and boost rankings sustainably. |
| AI and automation advantage | Automated tools and AI agents make keeping your site fast and efficient much easier for SMBs. |
What is a website performance review?
A website performance review is a structured analysis of how fast, stable, and user-friendly your site is across real-world conditions. Think of it as a health check for your digital storefront. It goes well beyond simply loading a page and seeing if it appears. A proper review examines how quickly your content becomes visible, how smoothly users can interact with your site, and whether elements shift around unexpectedly as the page loads.
For SMBs, the outcomes of a thorough review are concrete and measurable: faster load times, reduced bounce rates, higher conversion rates, and improved search engine rankings. Every second of delay in page load has been shown to reduce conversions, and unstable layouts frustrate users into leaving before they ever read your offer.
A complete performance review typically covers several key areas:
- Performance metrics: Speed, responsiveness, and visual stability scores
- User experience checks: Navigation flow, readability, and interactive element behaviour
- Mobile readiness: How your site performs on smartphones and tablets, which now account for the majority of web traffic
- SEO technicals: Crawlability, indexing issues, and structured data
One important distinction every business owner should understand is the difference between lab data and field data. Lab data comes from controlled testing tools like Lighthouse or PageSpeed Insights, which simulate a page load under fixed conditions. Field data, collected through tools like CrUX (Chrome User Experience Report) or Real User Monitoring (RUM), reflects how actual visitors on real devices and networks experience your site. Performance audits use both: lab data for diagnosis and field data for validation, and the two can differ by as much as 40 to 60%.
"A performance review is not a one-time report card. It is an ongoing conversation between your site and its users — and the data tells you exactly what that conversation sounds like."
If you are already considering whether to outsource web management to a specialist, understanding what a performance review entails helps you ask the right questions and evaluate what you are getting.
The core metrics: INP, LCP, and CLS explained
Knowing what a review covers sets the stage for understanding the actual metrics with real business consequences. Google's Core Web Vitals are the three primary signals used to measure page experience, and each one maps directly to a user behaviour that affects your bottom line.
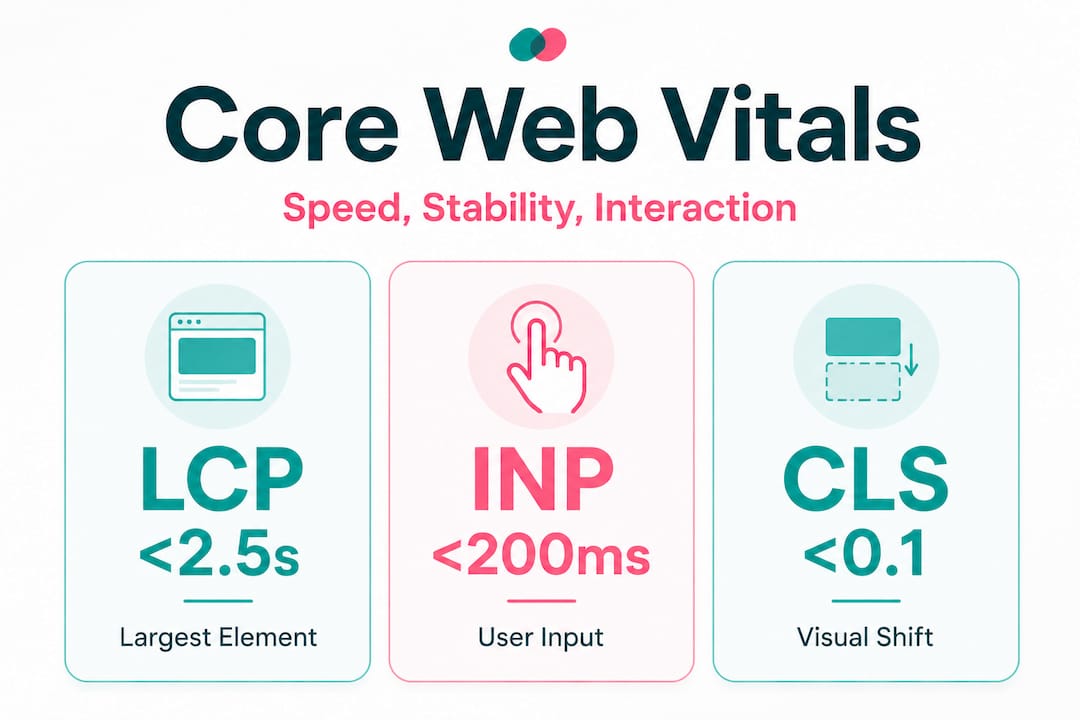
INP: Interaction to Next Paint measures the delay between a user's input (clicking a button, tapping a link) and the visual response on screen. A sluggish INP makes your site feel broken, even if it loaded quickly. Users who experience slow interactions abandon tasks and leave.
LCP: Largest Contentful Paint measures how long it takes for the largest visible element on the page — typically a hero image or headline — to fully render. This is the metric most closely tied to the perception of speed. If your hero image takes four seconds to appear, visitors assume your entire site is slow.
CLS: Cumulative Layout Shift measures visual instability. If a button jumps down the page because an image loaded late, and a user accidentally clicks the wrong thing, that is a high CLS event. It is one of the most frustrating experiences on mobile devices.
| Metric | Good | Needs improvement | Poor |
|---|---|---|---|
| INP | Under 200ms | 200ms to 500ms | Over 500ms |
| LCP | Under 2.5s | 2.5s to 4s | Over 4s |
| CLS | Under 0.1 | 0.1 to 0.25 | Over 0.25 |
43% of sites currently fail the INP benchmark alone, which means nearly half of all websites are delivering a noticeably sluggish interactive experience to their visitors. The business impact is direct: failed Core Web Vitals correlate with higher bounce rates and lower search rankings.
The most common reasons sites fail each metric are worth knowing:
- INP failures typically stem from long JavaScript tasks over 50ms, deep DOM structures, and layout thrashing caused by poorly ordered scripts
- LCP failures are usually caused by a high Time to First Byte (TTFB) over 600ms or unoptimised hero images that are too large or not preloaded
- CLS failures come from images and fonts without declared dimensions, and dynamic banners or ads that push content down after the initial render
Pro Tip: Run your site through Google's PageSpeed Insights and look specifically at the "Field Data" section at the top. That section reflects real user experiences, not just a simulated test. If your field data shows poor INP, that is the first metric to address.
Improving these metrics is not just about technical pride. It directly supports your operational efficiency checklist by reducing the time your team spends handling complaints about a broken or frustrating website experience.
Lab vs. field data: how SMBs should interpret their results
With a grip on the core metrics, SMBs need to make sense of sometimes confusing reports and test results. It is entirely common to run a Lighthouse test and see a score of 90, then check Google Search Console and find your field data showing "Poor" for LCP. This discrepancy confuses many business owners into dismissing the data entirely. That is a costly mistake.
| Lab data | Field data | |
|---|---|---|
| Tools | Lighthouse, PageSpeed Insights | CrUX, Google Search Console, RUM tools |
| Best for | Diagnosing specific issues | Understanding real user impact |
| Conditions | Controlled, simulated | Real devices, real networks |
| Limitation | Does not reflect user diversity | Requires sufficient traffic volume |
| SEO relevance | Indirect (diagnostic) | Direct (Google uses field data for ranking signals) |
Lab data is excellent for identifying what is broken and why. It gives you a repeatable, controlled environment to test fixes before deploying them. Field data tells you how bad the problem actually is for your real visitors. Performance audits that rely on lab data alone can miss issues that only appear under real network conditions, which explains the 40 to 60% variance between the two data sources.
The strategic guidance here is straightforward: prioritise field data over lab scores when assessing SEO impact, and use continuous RUM monitoring to prevent regressions after you make improvements.
Here is a practical approach to reconciling the two data sources:
- Start with field data in Google Search Console to identify which pages have the most urgent real-world issues
- Use Lighthouse or PageSpeed Insights on those specific pages to diagnose the root cause
- Implement fixes in a staging environment where possible
- Re-run lab tests to confirm the fix works under controlled conditions
- Monitor field data over the following two to four weeks to confirm the improvement registers for real users
Pro Tip: If your site does not yet have enough traffic to generate CrUX field data, focus entirely on lab tools for now. Once your traffic grows, shift your primary attention to field data for ongoing monitoring.
Pairing performance monitoring with AI productivity tips for your team means you are not just fixing your site in isolation. You are building a more responsive, data-informed operation overall. And when you connect performance data to AI operational efficiency workflows, you create feedback loops that flag issues before they compound.
Common performance pitfalls and quick wins for 2026
Understanding pitfalls and easy solutions creates actionable momentum from complex data. Many SMB websites share the same handful of avoidable problems, and fixing them often produces compounding benefits for both conversion rates and search rankings simultaneously.
The most frequent technical mistakes include:
- Slow server response times: A TTFB over 600ms delays everything downstream. Upgrading to a faster hosting plan or enabling a content delivery network (CDN) is often the single highest-impact fix available
- Heavy, unoptimised JavaScript: Long JS tasks over 50ms block the browser from responding to user input, directly causing INP failures. Auditing and deferring non-critical scripts is a quick win
- Missing image dimensions: When images do not have declared width and height attributes in the HTML, the browser cannot reserve space for them. Content shifts as they load, causing CLS failures
- Dynamic banners and pop-ups: Ads, cookie notices, and promotional banners that load after the initial render push content down the page, creating jarring layout shifts
- Uncompressed hero images: A 4MB hero image on your homepage is one of the most common LCP killers. Converting images to WebP format and compressing them to under 200KB can cut LCP times dramatically
A real-world example: a local service business with a 3.8-second LCP discovers their hero image is 6MB and served without a preload hint. Compressing the image to 180KB and adding a preload tag drops their LCP to 1.9 seconds. Their bounce rate on mobile drops noticeably within two weeks, and their Google Business Profile starts ranking higher for local searches.

Statistic to keep front of mind: Passing all Core Web Vitals correlates with 24% lower bounce rates and measurably better rankings. That is not a marginal gain. For a business receiving 500 visitors per month, a 24% reduction in bounce rate means 120 more people engaging with your content and offers every single month.
Pro Tip: Set up a free Google Search Console account and navigate to the "Core Web Vitals" report. It groups your pages into "Good," "Needs Improvement," and "Poor" categories based on real user data. Start with the "Poor" pages and work your way up.
For a structured approach to implementing these improvements, the AI productivity improvement guide offers a practical framework for building systematic processes around site maintenance.
Turning performance reviews into business results
After identifying what to fix, the final piece is integrating performance gains into overall operational success. Technical improvements only create business value when they are connected to the outcomes you actually care about: more leads, more sales, and a team that is not constantly firefighting website problems.
Here is how to build performance reviews into your regular business rhythm:
- Schedule a quarterly review using both lab and field data tools. Treat it like a financial review. Block time, assign ownership, and document findings
- Set performance budgets for your key pages. A performance budget is a threshold (for example, LCP under 2.5 seconds) that triggers action if crossed. This prevents gradual decay from going unnoticed
- Connect performance to conversion tracking. Use Google Analytics or a similar tool to correlate performance improvements with changes in lead form submissions, call clicks, or purchase completions
- Automate monitoring alerts. Tools like Google Search Console send email alerts when Core Web Vitals degrade. Set these up so you are not relying on manual checks
"The businesses that treat performance reviews as a recurring operational habit, not a one-time project, are the ones that compound their gains over time. Every improvement builds on the last."
The connection between site performance and AI productivity strategies is more direct than most operators realise. When AI agents handle routine monitoring, flag regressions, and surface actionable reports, your team spends less time digging through dashboards and more time acting on insights. That is where the real leverage lives.
Why most SMBs misunderstand website performance reviews
Here is the uncomfortable truth we have observed across hundreds of business infrastructure projects: most SMBs do not fail at performance reviews because they lack data. They fail because they have no process for translating data into decisions.
Business owners run a Lighthouse test, see a score of 67, feel vaguely anxious, and then close the tab. The problem is not the score. The problem is that no one has connected that score to a specific business outcome, assigned ownership of the fix, or built a review cadence that keeps the site from regressing three months later.
Chasing a perfect score of 100 is also a trap. We have seen businesses spend weeks optimising for a lab score while their field data barely moved. A score of 78 with strong field data and a low bounce rate will outperform a score of 95 with poor real-world responsiveness every time. The score is a diagnostic tool, not the destination.
What actually works is embedding performance reviews into existing staff routines. Not as an annual audit that gets deprioritised, but as a monthly or quarterly habit with a clear owner, a simple checklist, and direct accountability to business metrics. When performance review findings are documented and shared with the team, they become institutional knowledge rather than a one-off fix that gets undone the next time someone installs a new plugin.
This is precisely where outsourcing web management to a managed service provider makes strategic sense. Not because SMBs cannot learn the technical side, but because the operational cost of maintaining that expertise in-house often exceeds the cost of the service itself. Continuous monitoring, automated fixes, and expert oversight free you to focus on what actually grows your business.
How AI-driven services put performance reviews on autopilot
Manual performance reviews take time, require technical knowledge, and are easy to deprioritise when business gets busy. That is exactly why so many sites quietly degrade between audits.

HumanOS changes that equation entirely. Our managed web services include continuous performance monitoring, proactive optimisation, and expert oversight across all three service tiers — from the Foundation plan for early-stage operators all the way to the Scale tier for multi-location and ecommerce businesses. You get enterprise-grade performance management without the enterprise price tag or the weekend spent troubleshooting plugins. Our managed web services are built to keep your site fast, stable, and converting while our AI agents handle the operational layer that keeps your team productive. Start with a 3-day free trial and see the difference that continuous optimisation makes compared to a static site that decays from day one.
Frequently asked questions
What is INP and why does it matter for my website?
INP (Interaction to Next Paint) measures the delay between a user's input and the visual response on screen. Passing its benchmark improves site usability and is directly correlated with lower bounce rates and better search rankings.
How often should I conduct a website performance review?
Quarterly reviews are a solid baseline, but continuous RUM monitoring is strongly recommended to catch regressions before they affect your rankings or conversion rates.
Will improving my site's Core Web Vitals boost my search rankings?
Yes. Passing all Core Web Vitals correlates with 24% lower bounce rates and measurably better search rankings, making it one of the highest-return technical investments an SMB can make.
What is the difference between CrUX and Lighthouse?
Lighthouse runs tests in a simulated environment for diagnostic purposes, while CrUX reports real user data collected from actual visitors to your site. Both serve different and complementary roles in a complete performance review.